Progress Monitoring Techniques
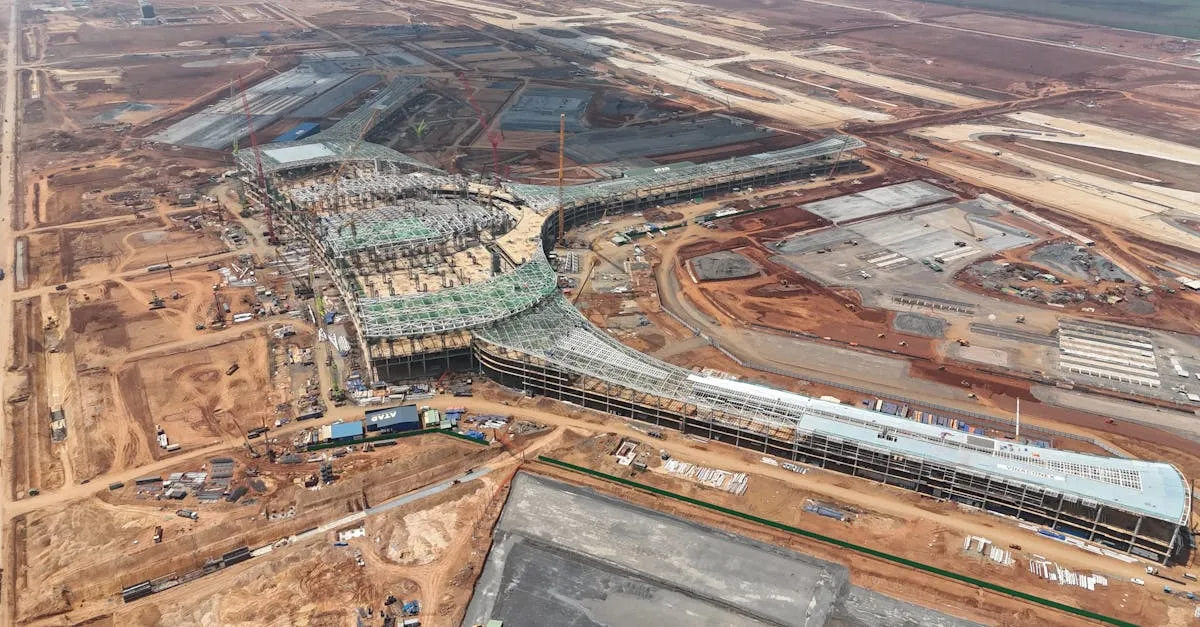 The most common drone service on construction sites is also the simplest: regular aerial photography and mapping that shows what changed since the last visit. Project managers use this data for scheduling, reporting to investors, and resolving disputes.
The Consistency Problem
Progress monitoring only works if each flight produces data that can be compared directly with previous flights. This means flying the same altitude, the same camera settings, and ideally the same time of day for every visit.
Inconsistent data is worse than no data. If the first flight was shot from 80 meters at noon and the second from 120 meters at dusk, the comparison is meaningless. Shadows fall differently. Resolution changes. Objects appear at different scales.
Your Flight Protocol
Establish a standard protocol for each client and stick to it:
- Altitude: Fixed for the project duration (typically 60-80 meters)
- Overlap: 75% front, 65% side (consistent across all visits)
- Camera settings: Manual exposure, fixed white balance
- Time of day: Within a 2-hour window (ideally 10am-2pm for consistent shadows)
- Flight path: Same grid pattern, saved in your mapping app
- Ground control: Same GCPs measured at the same locations
Document this protocol in your service agreement. It prevents “why does this look different than last month” conversations.
Deliverables for Progress Monitoring
Orthomosaic map: A measurable, georeferenced aerial photo of the entire site. Updated each visit. The project team overlays this on their plans to verify construction against design.
Progress photos: Key angles captured from the same position each visit. Five to ten targeted shots showing major work areas: the building footprint, excavation areas, material staging, and access roads.
Comparison report: Side-by-side or overlaid imagery showing the previous visit versus current visit. Highlight areas of significant change with annotations.
Progress percentage: If the contract includes it, estimate completion percentage based on visual comparison with the design plans. This is subjective, so always caveat it as an estimate, not a measurement.
Reporting Formats
Deliver reports that busy project managers can absorb in five minutes:
- A single-page PDF with the current orthomosaic, key progress photos, and brief notes
- A KMZ file for Google Earth viewing (many construction PMs live in Google Earth)
- Raw data files in a shared folder for the engineering team
Avoid massive PDF reports that nobody reads. One clear page beats twenty detailed pages that get filed without being opened.
Pricing Progress Monitoring
Price by the visit or by the month:
- Per visit: $200-400 for photography, $500-1,000 for orthomosaic mapping
- Monthly package (4 visits): $800-2,000 for photos, $1,500-3,500 for mapping
- Weekly package (4 visits/month): $1,500-4,000 for mapping
The key selling point: your progress data prevents disputes, catches delays early, and gives the project manager documentation they cannot get any other way.